Abel Transform
Abel transform
Let us consider the normalized phase space x-p_x and a 2D matched density distribution \rho. For the linear case, a matched distribution is rotation invariant, that is, in the J,\mu variables, we can write \rho(r=\sqrt{2 J},\phi)=\rho(r). Here we use the r-notation instead of the J-notation to stay compatible with the Abel transform's standard form.
We consider for \rho the following normalization: \begin{equation} \int_0^\infty \int_0^{2\pi} \rho( r ) r dr d\phi = 2\pi \int_0^\infty \rho( r ) r dr =1. \end{equation}
By defining a linear radial density \rho_r(r)=2\pi \rho(r) \ r, we have
Where
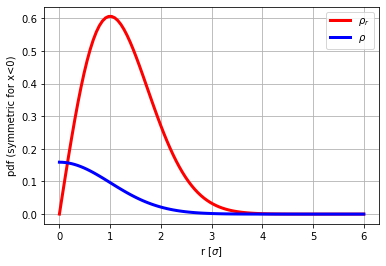
- the \rho(r) is the 2D density to be Abel-transformed (see Example 3).
- the \rho_r(r) is the 1D density to be used in the numerical experiment we will perform (see Example 2). In fact is more convenient for our purpose to populate a random vector starting from a 1D density than a 2D one.
Example 1
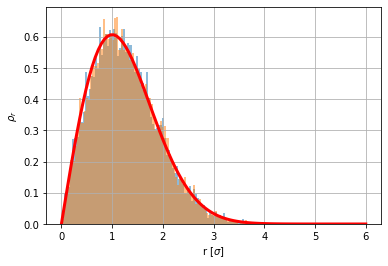
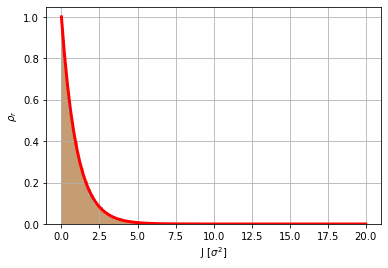
Given two normal distributed variables x-p_x, compute numerically the distribution the \rho_r(r) and \rho_r(J) (where we preferred the simplicity of the notation and we indulged its rigor).
from madxp import luminosity as lumi
from matplotlib import pylab as plt
import numpy as np
from scipy import special
import matplotlib
from scipy.stats import norm
def gauss(x,sigma):
    return 1/np.sqrt(2*np.pi)/sigma*np.exp(-(x)**2/2/sigma**2)
# Showing that rho_r(r) distributes like a Chi-distribution
N=10000
x=np.random.randn(N)
y=np.random.randn(N)

plt.hist(np.sqrt(x**2+y**2),100,density=True,alpha=.5); # Chi-distribution of type 2 or Rayleigh-distribution

from scipy.stats import chi
rho_r = chi.rvs(2, size=N)
plt.hist(rho_r,100,density=True,alpha=.5)

r=np.linspace(0,6,100)
plt.plot(r, chi.pdf(r,2),'r',lw=3)
plt.grid(True)
plt.xlabel('r [$\sigma$]')
plt.ylabel('$\\rho_r$');
# Showing that rho_r(J) distributes like a chi2-distribution
N=10000
x=np.random.randn(N)
y=np.random.randn(N)

plt.hist((x**2+y**2)/2,100,density=True,alpha=.5); # chi2-squared distribution of type 2

from scipy.stats import chi2
rho_r = chi2.rvs(2, size=N)/2
plt.hist(rho_r,100,density=True,alpha=.5)

J=np.linspace(0,20,100)
plt.plot(J, 2*chi2.pdf(J*2,2),'r',lw=3)
plt.grid(True)
plt.xlabel('J [$\sigma^2$]')
plt.ylabel('$\\rho_r$');
Example 2
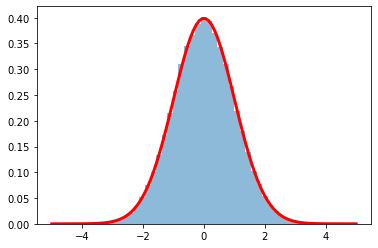
Starting from two 1D distributions
- rho_r (Rayleigh-distributed) and
- rho_phi(uniform distributed in [0-2\pi])
verify that x is normal distributed.
from scipy.stats import chi
N=100000
rho_r = chi.rvs(2, size=N)
rho_phi=np.random.rand(N)*2*np.pi
x=rho_r*np.cos(rho_phi)
plt.hist(x,50,density=True,alpha=.5 );
x=np.linspace(-5,5,100)
plt.plot(x, gauss(x,1),'r',lw=3)
[<matplotlib.lines.Line2D at 0x7fb2e1b8b5d0>]
Example 3
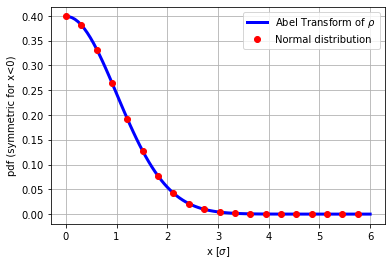
From rho_r (chi-distributed), compute the rho and verify that its Abel-transform is normal distributed.
from scipy.stats import chi


r=np.linspace(0.00001,6,100)
rho_r=chi.pdf(r,2)
plt.plot(r, rho_r,'r',lw=3,label='$\\rho_r$')

#find rho
rho=rho_r/2/np.pi/r
from abel.direct import direct_transform
from abel.tools.analytical import GaussianAnalytical
aux=direct_transform(rho, dr=np.diff(r)[0], direction="forward", correction=True)

plt.plot(r,rho,'b',lw=3,label='$\\rho$')
plt.grid(True)
plt.ylabel('pdf (symmetric for x<0)')
plt.xlabel('r [$\sigma$]')
plt.legend(loc='best')


plt.figure()
plt.plot(r,aux,'b',label='Abel Transform of $\\rho$', lw=3)

plt.plot(r[0::5],gauss(r[0::5],1),'or',label='Normal distribution', lw=3)

plt.ylabel('pdf (symmetric for x<0)')
plt.xlabel('x [$\sigma$]')
plt.legend(loc='best')
plt.grid(True)
Example 4
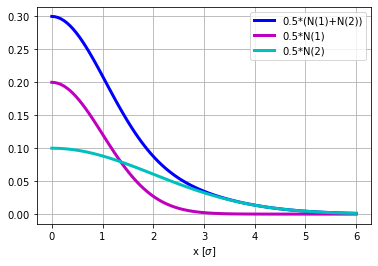
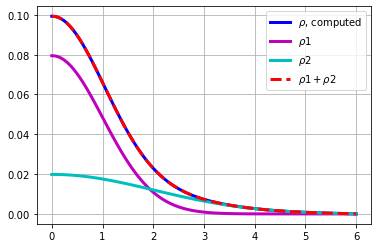
Let us consider a double-Gaussian beam x-profile. Indeed the Abel transform is linear, this is therefore is a sanity check.
from scipy.stats import chi

r=np.linspace(0,6,100)

from abel.direct import direct_transform
from abel.tools.analytical import GaussianAnalytical

rho=direct_transform(.5*gauss(r,1)+.5*gauss(r,2), dr=np.diff(r)[0], direction="inverse", correction=True)
rho1=direct_transform(.5*gauss(r,1), dr=np.diff(r)[0], direction="inverse", correction=True)
rho2=direct_transform(.5*gauss(r,2), dr=np.diff(r)[0], direction="inverse", correction=True)


plt.figure()
plt.plot(r,.5*gauss(r,1)+.5*gauss(r,2),'b',lw=3,label='0.5*(N(1)+N(2))')
plt.plot(r,.5*gauss(r,1),'m',lw=3,label='0.5*N(1)')
plt.plot(r,.5*gauss(r,2),'c',lw=3,label='0.5*N(2)')
plt.grid(True)
plt.xlabel('x [$\sigma$]')
plt.legend(loc='best')

plt.figure()
plt.plot(r,rho,'b',lw=3,label='$\\rho$, computed')
plt.plot(r,rho1,'m',lw=3,label='$\\rho1$')
plt.plot(r,rho2,'c',lw=3,label='$\\rho2$')
plt.plot(r,rho1+rho2,'--r',lw=3,label='$\\rho1 +\\rho2$')
plt.legend(loc='best')
plt.grid(True)


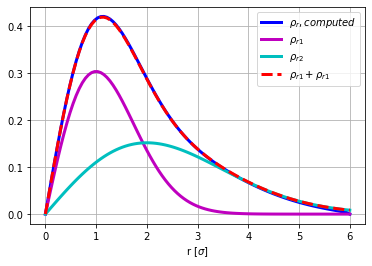
rho_r=rho*2*np.pi*r

rho_r1=0.5*chi.pdf(r,2,scale=1)
rho_r2=0.5*chi.pdf(r,2,scale=2)

plt.figure()
plt.plot(r,rho_r,'b',lw=3,label='$\\rho_r, computed$')
plt.plot(r,rho_r1,'m',lw=3,label='$\\rho_{r1}$' )
plt.plot(r,rho_r2,'c',lw=3,label='$\\rho_{r2}$' )
plt.plot(r,rho_r1+rho_r2,'r--',lw=3,label='$\\rho_{r1}+\\rho_{r1}$' )
plt.grid(True)
plt.xlabel('r [$\sigma$]')
plt.legend(loc='best');
pwd
'/eos/home-s/sterbini/MD_ANALYSIS/2020/doubleGaussian'